Low reflectance at Extreme Ultraviolet (EUV)
EUV Reflectivity measurements
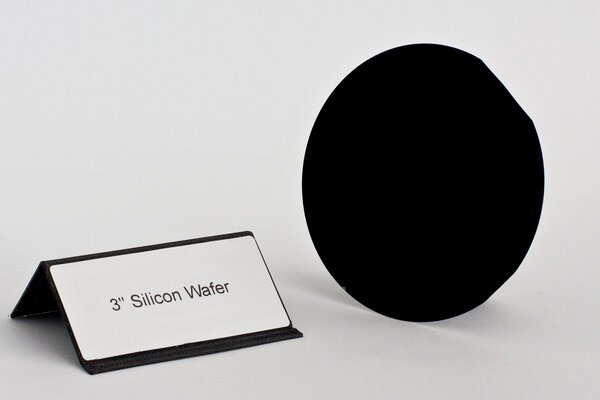
on Acktar Sample Magic Black
S. Doring, Dr. K. Mann
Laser-Laboratorium G¨ottingen e.V.
October 28, 2011
Measurement report
Introduction
Using the EUV source of LLG, reflectivity measurements have been conducted on Magic Black Sample (Ref. #333) at a center wavelength of 12.98nm. The measurement proce- dures and results are described in the following. All angles described in this report are grazing angles (relative to sample surface).
Setup
Fig.1 shows the experimetal setup. The EUV radiation is generated in the chamber on the left (source chamber) using a laser produced plasma from a gas puff target.
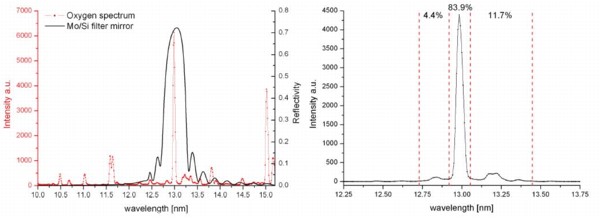
The spectral characteristics of the source depends on the employed target gas as shown in fig.2 (left). For the measurements Oxygen was used as target material.
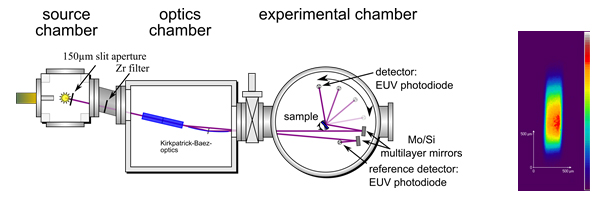
The light emitted by the source passes through a 150µm slit aperture placed approx- imately 2mm behind the plasma and a Zirconium filter which blocks higher wavelength components of the spectra.
In the optics chamber an optics in Kirkpatrick-Baez arrange- ment images the slit onto the sample placed in the middle of the experimental chamber via a Mo/Si multilayer mirror. This mirror works as a spectral filter in the EUV spectral region (blocking out-of-band radiation) and is adapted to the emission line of Oxygen at 12.98nm (cf fig. 2, right).
The reflectometer placed in the experimental chamber consists of two independent rotary stages for sample holder and detector diode, respectively. The beam diameter on the sample (perpendicular to the incident radiation) is appr. 300µm in horizontal and 500µm in vertical direction (cf fig. 1, right).
For monitoring of intensity fluctuations of the plasma source, a second EUV photodiode is used as a reference monitor. It is illuminated by a second filtering multilayer mirror with the same specifications as the main mirror.
Measurements
See tables below for setup specifications and measurement parameters.
| Parameters for measurements | |
|
geometry for measurements |

detector scans at 5◦/10◦ /45◦ |
| angular range | -10◦ to +10◦ relative to specular angle (2*sample angle) |
| angular detector step size | 0.1◦ |
| averaging | 25 EUV pulses/measurement point |
| Setup specifications | |
| angular accuracy | <1◦ |
| angular repeatability | <0.1◦ |
| absolute accuracy of reflectivity | <5% |
| absolute repeatability of reflectivity | <0.5% |
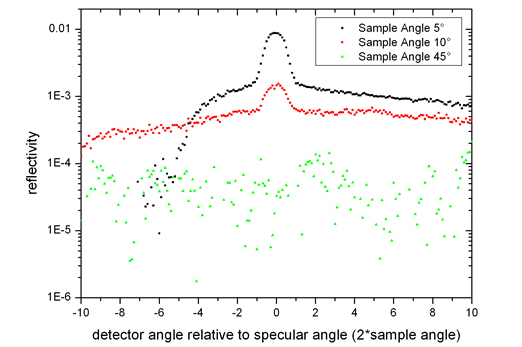
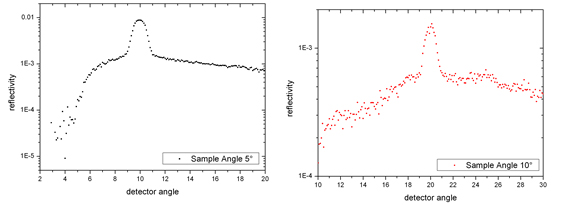
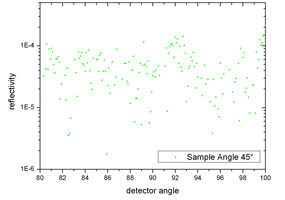
Three measurements have been conducted to analyse EUV light scattering properties of the sample.
For these the angle of incidence of the light onto the sample was set to 5◦ , 10◦ and 5◦ degrees grazing angle (angle to sample surface), respectively.
For each of these positions a detector scan has been made, centered on the angle of specular reflectance with a range of -10◦ to +10◦. All the measurements are background corrected.
Conclusion
The data recorded for 45◦ sample angle represents the noise level of the detector. For this sample angle either all radiation impinging on the sample is absorbed or the re- flected/scattered light is too weak to be detected with our equipment.
Under 5◦ and 10◦ sample angle the specular reflectance of the measurement beam can be seen as peaks in the middle of the respective datagrams. These peaks have a reflectivity of approximately 1% and 0.1% respectively.
The flanks of these peaks correspond to the scattered light. Their asymetry stems from the fact that under small angles of incidence the scattered light is blocked by the sample itself.