Acktar BRDF + TIS database
1 Introduction
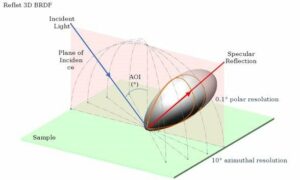
1.1 BRDF
Bidirectional Reflectance and Transmittance Distribution Functions (BRDF, BTDF) are the fundamental way to describe and assess the distribution of scattering from optical components. The data is also an essential input for straylight simulations using optical engineering software like ZEMAX, RAYJACK ONE, FRED, ASAP, LightTools, TracePro, and others.
Because of the numerous possible origins of scattering (roughness, defects, bulk, coatings) and the rather complex relationships between such imperfections and light scattering, the BRDF of optical components must be measured. This is in particular true for high-end optical components for e.g. space, semiconductors, IR sensing, LIDAR, imaging, bio-analytics, medical and other demanding photonic applications.
1.2 Acktar’s ultra-black coatings
To suppress stray light in complex optical systems, baffles and black diffusing absorber coatings are used. Even though such surfaces might look perfectly diffuse and black at near normal incidence and visible wavelengths, the scattering distribution usually changes at larger angles of incidence and at other wavelengths. In the extreme case of near grazing incidence and/or infrared wavelengths, some materials that are black diffusers in the visible are known to behave like good mirrors causing stray radiation to bounce within the optical system instead of being suppressed. The scattering of black coatings must therefore be measured at application conditions.
This database of BRDF and TIS (total integrated scatter, hemispherical reflectance) measurements on all of Acktar’s deep black coatings and foils provides an unprecedented basis for the development and simulation of optical systems. Above all, the demonstration of the optical properties and performance in the range of larger angles of incidence gives the optics developer the greatest possible security and confidence.
2 Description of the data
2.1 Wavelength ranges
BRDF measurements have been carried out at VIS (white light) and NIR (monochrome 1.55µm).
Spectral TIS data is available at VIS (400nm to 800nm) and NIR (780nm to 1.650nm).
2.2 Description of the raw data in text format
1 folder per wavelength containing 1 folder per sample with:
sample_/IR_BRDF_X0.txt corresponding to 3D BRDF (reflectance) measurement of sample for angle of incidence X0.0°. In those files, lines correspond to scattering angle BSDF values going from -90° (one side of sample) to 0° (zenith) and ending at 90° (other side of sample). Each column is a 2D BSDF measurement in a different plane of measurement (azimuth), going from -90° (in plane of incidence measurement), to 0° (orthogonal plane to in plane of incidence), ending at +90° (in plane of incidence measurement)
2.3 Description of the data in the Excel file
1 excel file per sample summarizing and plotting BSDF values with:
- 1st tab being TIS values. First column is angle of incidence and last column gives reflectance ratio. There is also the spectral TIS measurement, with column F representing the wavelength (nm), and then one column per angle of incidence (AOI)
- 1 tab per measurement (per angle of incidence) corresponding to 3D BRDF measurements of sample for angle of incidence X0.0° in reflectance (BRDF). Just like the txt files, each column is a 2D BSDF in different azimuth planes (plane of measurement) going from -90° (in plane of incidence measurement), to 0° (orthogonal plane to in plane of incidence), ending at +90° (again in plane of incidence).
3 Analysis – What to expect:
3.1 Direct coating products
3.1.1 FractalBlack™:
For both wavelengths (IR and visible) the TIS increases with the Angle of Incidence (AOI) and pass from around 1,5% to around 5%.
Regarding the spectral TIS, for IR measurements the TIS is globally stable with the wavelength. There is no notable spectral dependency. However, for visible measurements, there is a small decrease of the TIS with the wavelength, but it is not very marked.
Concerning the BRDF measurement, for both wavelengths, the behaviour is almost Lambertian (around 1.5% for IR and around 2% for visible). There is a peak for high scattering angle for higher AOI.
3.1.2 MagicBlack™:
Again, for both wavelengths, the TIS increases with the AOI and pass from around 1.5% to around 5% for IR and from 0,5% to around 2.5%. for visible. So, it is slightly higher for IR measurements than for visible.
We note a spectral dependency for IR measurements for this sample. Indeed, the TIS increases with the increasing of the wavelength. However, for visible no spectral dependency are noted.
Concerning the BRDF measurement, we note a different behaviour between IR and visible. For IR, it is almost Lambertian (around 1.5%). There is a peak for high scattering angle for higher AOI.
For visible BRDF, the behaviour is different from the IR measurement. Indeed, we note the presence of a small specular peak, with again a Lambertian background (around 0.6%), so lower than for IR measurement.
3.1.3 VacuumBlack™:
The TIS increases with the AOI and pass from around 1% to around 5% for IR and from around 1% to around 4% for visible.
Regarding the spectral TIS, we note for IR a spectral dependency only for high angle of incidence. Indeed, for those the TIS increases with the increasing of the wavelength. However, there is no spectral dependency for the visible wavelength.
Concerning the BRDF measurements, the behaviour is close between visible and IR. It is almost Lambertian (around 1%). There is a peak for high scattering angle for higher AOI.
3.1.4 LambertianBlack™:
This sample is close to a perfect Lambertian sample. There is no specular component visible at low angles of incidence. Lambertian background is lower in VIS than NIR, which is coherent with reflectance measurement where sample reflects less than 1% in VIS and more than 1.5% in NIR.
Spectral reflectance rises with wavelength.
3.2 Coated foil products
3.2.1 MetalVelvet™
We can see a difference in reflectance values from VIS to IR range. Where in VIS the sample is reflecting ~0.5% over the different angle of incidence, in IR range sample reflects much more with ~3%. BRDF levels confirm this behaviour in IR range with values around 0.005 sr-1.
Scattering behaviour, although level is different, is pretty similar between VIS and IR range. There is a clear Lambertian background plus a small specular component.
3.2.2 SpectralBlack™:
The TIS increases with the AOI and pass from around 1.5% to around 7.5% for IR and from around 0.5% to around 4% for visible.
For both we note a spectral dependency. Indeed, the TIS increases with the increasing of the wavelength. It is more marked for IR measurements.
Concerning the BRDF measurements, we can clearly note an anisotropy of the sample which is in line with the fact that it is streaked.
3.2.3 ScatterBlack™:
This sample is anisotropic and was measured with incident light along strips.
Sample has mostly a Lambertian scattering background at a level around ~0.004 sr-1 in VIS and 0.005 sr-1 in NIR (~1.5%). There is a slight specular component that is more present in the visible range. Lambertian background behaviour is coherent with TIS that is slightly more important in NIR than in VIS. Spectral reflectance is quite constant over 450nm-1400nm with a small bump ~900nm. After 1400nm reflectance rises a bit.
3.2.4 MAXIBlack™:
For the TIS, observations are the same as previously, the TIS increases with the AOI and pass from around 1% to around 6% for IR and from around 1% to around 5%.
For both wavelengths, we note a small spectral dependency for this one. Indeed, the TIS increases slowly with the increasing of the wavelength. Maybe this dependency is more marked for IR than for visible.
Concerning the BRDF measurements, for both there is a specular peak with scattering on each side of this peak and a Lambertian background. We must note that the specular peak is higher for IR than for visible.
3.2.5 HexaBlack™:
For this one, the behaviour of the TIS with the angle of incidence is a little bit different. Indeed, for both wavelengths, the TIS is globally stable with the AOI (around 1% for IR and around 0.5% for visible).
For IR we note a small increase of the TIS with the increasing wavelength. However, there is no notable spectral dependency for the visible.
Concerning the BRDF measurements we note for, both wavelengths, a very large Gaussian scattering with a Lambertian background. The Lambertian background for visible is lower than for the IR.
Author : Alexander Telle ([email protected])